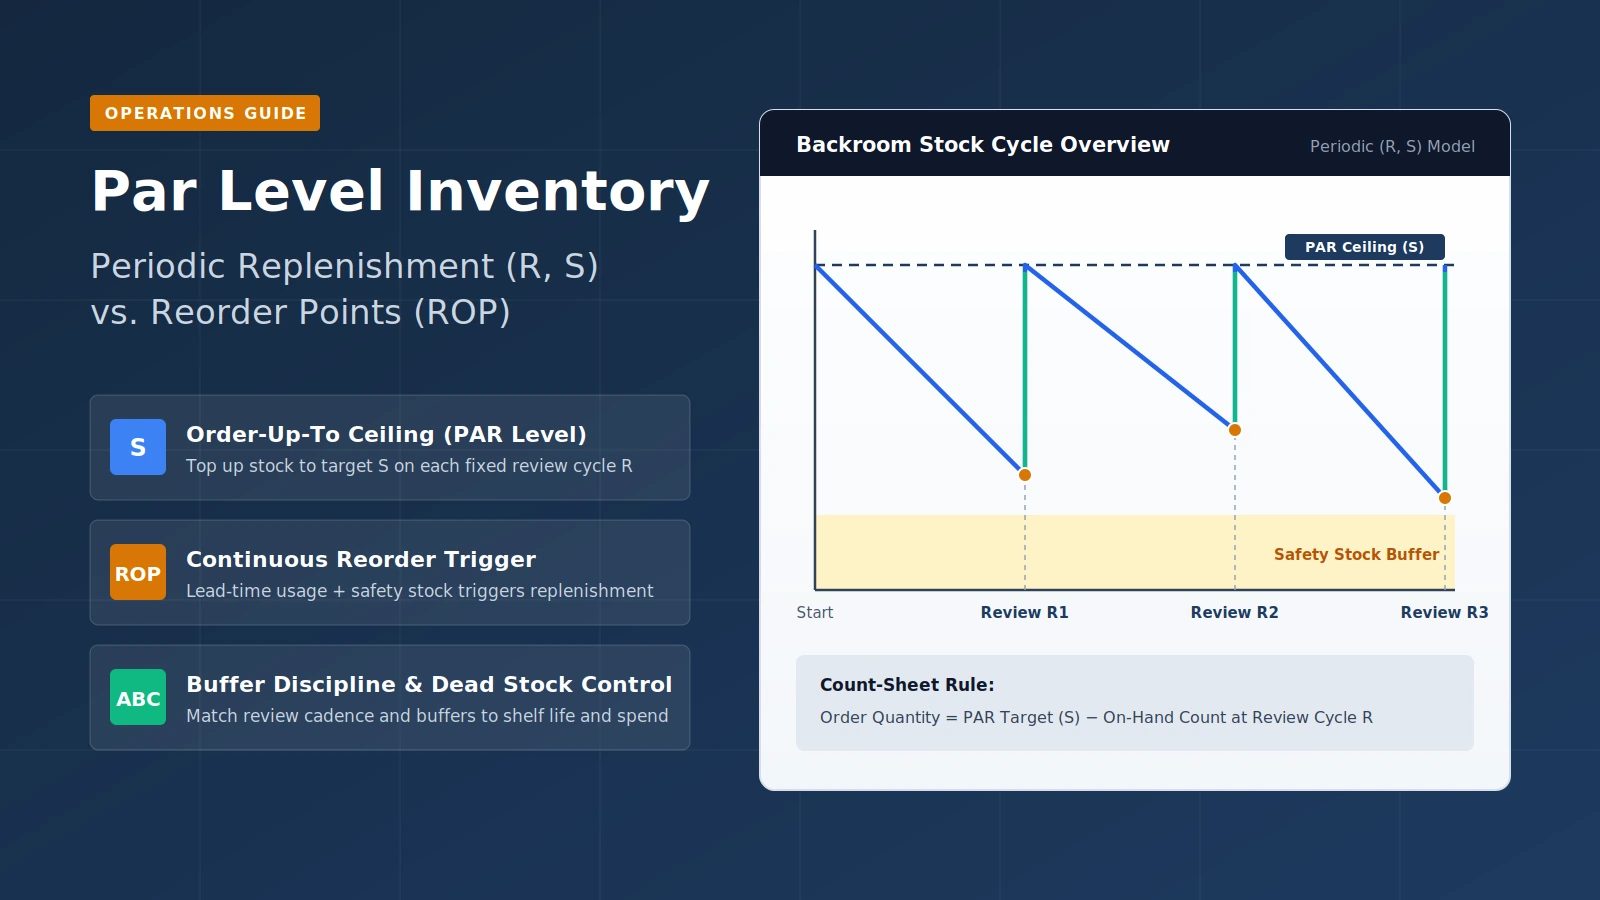
Par level inventory is a periodic review replenishment method—known in operations literature as Periodic Automatic Replenishment, or the (R, S) policy—where store staff check stock on each fixed review cycle (R) and order the gap needed to restore inventory up to a target ceiling (S), while a reorder point (ROP) sets the minimum threshold that triggers reorders.
Effective store replenishment separates how high you top up shelves from when an order is triggered, balancing stockout prevention against holding costs, spoilage, and dead stock. Browse the Operations hub for related store worksheets and physical shelf-planning guides.
What does PAR stand for in inventory control and how does an order-up-to target work?
PAR stands for Periodic Automatic Replenishment and maps directly to the (R, S) periodic review policy, in which PAR level and order up-to-level (S) serve as equivalent target ceilings. At every scheduled review cycle (R), staff count on-hand units and place an order sized to raise stock back up to level S.
As documented in Ahmadi et al. (2019) on PubMed Central, organizations adopt the (R, S) PAR policy widely because of its simplicity and its ability to consolidate orders across fixed replenishment periods. Instead of issuing scattered single-item orders throughout the week, a store groups replenishment onto a predictable calendar cadence so receiving, backroom put-away, and supplier deliveries follow a repeatable schedule.
Under a periodic inventory policy, the order placed at each review cycle must cover expected demand until the next scheduled order arrives, as outlined in the safety stock reference. Because order size fluctuates with actual sales since the previous count, the PAR ceiling S acts as the anchor rather than a fixed case quantity.
Setting PAR targets by personal experience rather than structured calculation is a documented failure mode that frequently yields overstocking. Anchoring S to measured consumption, supplier lead time, and an explicit safety buffer prevents managers from padding round numbers onto backroom shelves.
How do periodic review PAR systems differ from continuous reorder point triggers?
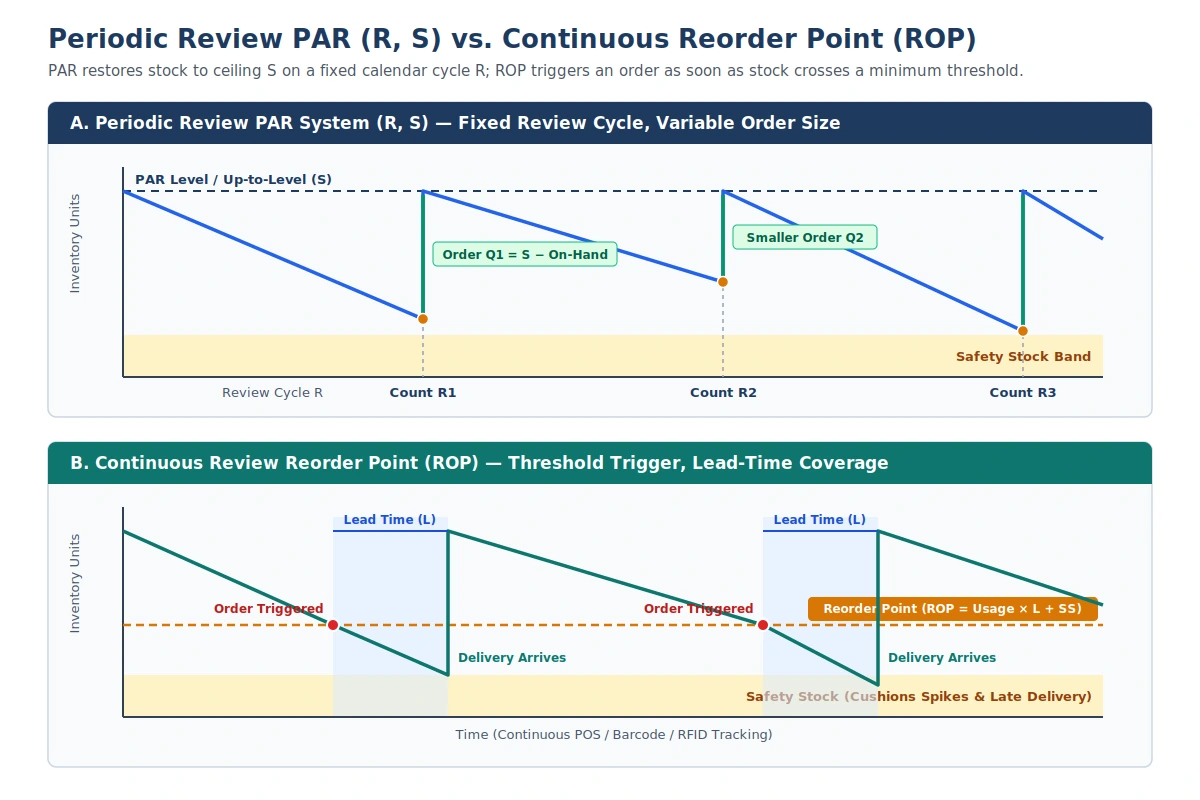
Periodic review PAR systems inspect stock at fixed calendar intervals to consolidate orders, whereas continuous review reorder point systems monitor stock continuously and trigger replenishment as soon as inventory drops below a minimum threshold. Under linear holding and shortage costs, (R, s, S) is optimal for periodic review and (r, Q) is optimal for continuous review.
Comparing standard periodic and continuous policies
Operations research classifies replenishment rules by whether review happens on a calendar schedule or continuously, and by whether the order quantity is variable (topping up to S) or fixed (ordering Q). The PubMed Central inventory review defines the core periodic and continuous policies below.
| Policy | Review Cadence (Unit) | Trigger Condition (Units) | Order Quantity (Units) | Operational Trade-Off |
|---|---|---|---|---|
| Periodic (R, S) / PAR | Fixed cycle R (days or weeks) | Every scheduled review cycle R | Variable gap to restore ceiling S | Simple order consolidation; requires manual count data |
| Periodic (R, s, S) | Fixed cycle R (days or weeks) | Stock at or below reorder point s at review | Variable gap up to ceiling S | Optimal periodic model under linear holding and shortage costs |
| Periodic (R, r, Q) | Fixed cycle R (days or weeks) | Stock at or below reorder point r at review | Fixed constant order size Q | Aligns scheduled counts with fixed supplier pack quantities |
| Continuous (s, S) | Real-time perpetual tracking | Stock falls below reorder point s | Variable gap up to ceiling S | Responds immediately to demand spikes; needs live capture |
| Continuous (r, Q) | Real-time perpetual tracking | Stock falls below reorder point r | Fixed constant order size Q | Optimal continuous model under linear holding and shortage costs |
Perpetual tracking, hybrid checks, and physical reconciliation
A purely periodic inventory control system relies on an actual physical count of all stock on hand at the close of each period, whereas a perpetual inventory control system takes an initial full count and then monitors additions and deletions continuously as they occur, as summarized in the inventory control reference. Using data capture technologies such as barcode and RFID enables perpetual tracking and can lower the cost of carrying inventory compared with purely periodic control.
Perpetual tracking does not eliminate physical counts. Even perpetual systems must be verified periodically against an actual physical count because scrap, human error, and theft gradually separate book records from shelf reality. Stores that want tighter control without constant manual counting can also use a hybrid model—replenishing periodically under an (s, S) rule at the beginning of a shift while maintaining intermediate monitoring between review periods.
How do lead-time usage and safety stock combine into a replenishment formula?
Because real-world supplier lead time is never zero, a replenishment threshold must stay above zero to cover the lag between placing an order and receiving delivery. The reorder point equals delivery time stock—normal consumption during lead time—plus safety stock held as protection against demand fluctuations or late deliveries.
Core reorder point formula and worked baseline example
In standard replenishment math, the reorder point (ROP), also called reorder level (ROL), combines two distinct components:
Reorder Point = Normal consumption during lead-time + Safety Stock
In statistical notation for the ROP formula, the first term E(L)E(D) represents average demand during lead time and the second term ss represents safety stock. Without safety stock, the baseline reorder level is:
Reorder level = Average daily usage rate × lead-time in days
Applying this baseline formula to a fast-moving retail item or checkout supply with an average daily usage rate of 50 units and a lead time of 7 days yields:
Reorder level = 50 units per day × 7 days = 350 units
In this baseline example, placing a replenishment order when on-hand stock reaches 350 units covers normal consumption until the delivery arrives. Adding safety stock above that 350-unit baseline protects against higher-than-planned sales or a late supplier shipment.
Sizing safety stock with service levels
Safety stock is extra buffer inventory held to reduce the risk of running out of stock when sales exceed plan or a supplier cannot deliver on time. Because carrying buffer stock raises holding costs, many organizations size safety stock around an explicit service level rather than guessing.
As detailed in the safety stock methodology, a 95% service level uses a standard normal z-factor of zα = 1.65. Accepting a lower service level reduces the required safety stock, while raising the target service level increases the buffer held on shelves and in backroom storage.
| Formula Component | Definition | Measurement Unit | Operational Role |
|---|---|---|---|
| Delivery time stock | Forecast normal consumption during supplier lead time | Units per lead-time window | Covers demand between order placement and delivery receipt |
| Baseline reorder level | Average daily usage rate × lead-time in days | Units (for example, 50 × 7 = 350 units) | Minimum trigger before adding a variability buffer |
| Safety stock (ss) | Buffer held for demand spikes and late deliveries | Units scaled by service-level z-factor | Prevents lost sales and customer turnover |
| Service-level factor (zα) | Inverse standard normal value for target service level | Dimensionless z-score (1.65 at 95%) | Balances stockout risk against holding cost |
| Periodic up-to-level (S) | Target PAR ceiling restored on review cycle R | Units per SKU | Covers expected demand until the next scheduled order arrives |
How do staff use a PAR count sheet and two-bin setup during scheduled stock counts?
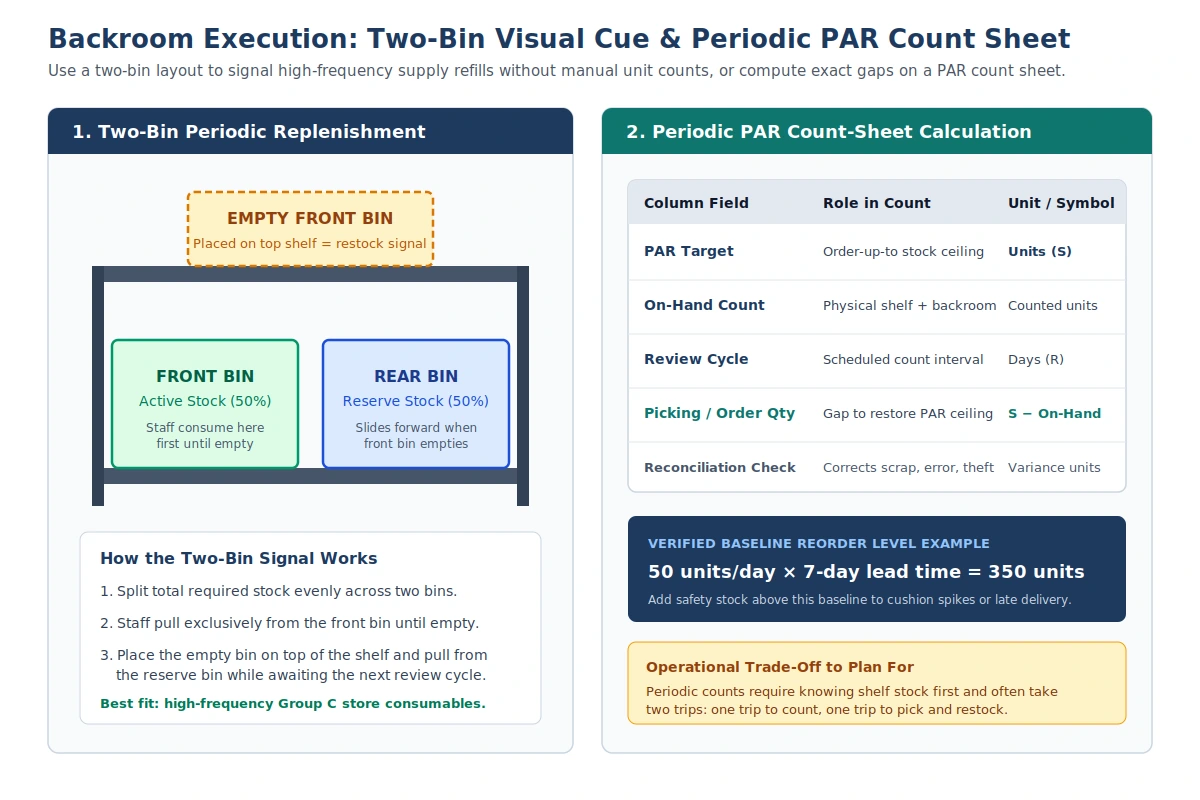
During a scheduled periodic review, staff count the physical on-hand quantity of each SKU on the shelf and in backroom storage, compare that count against the item’s up-to-level S, and generate a picking or order list equal to the exact gap needed to bring stock back to S.
Because a periodic review depends on knowing exactly how much stock sits on the shelf before picking, it often requires two trips for replenishment—one pass to count on-hand quantities and a second pass to pick and restock the shortfall. Before approving a higher PAR ceiling for a floor-stocked item, verify that the physical bay can actually hold the target quantity and weight using our retail planogram facings and shelf capacity guide.
For high-frequency backroom or point-of-use supplies where manual unit counting slows down staff, a two-bin replenishment layout replaces counting with a visual cue. Required stock is split evenly between two separate bins (or two compartments inside one bin); staff consume exclusively from the front bin until it is completely empty, then place the empty bin on top of the shelf to signal replenishment on the next review period while drawing from the reserve bin.
| Count-Sheet Column | What Staff Record | Unit | Action Taken |
|---|---|---|---|
| PAR Target (S) | Approved order-up-to stock ceiling | Units | Reference ceiling for the current season |
| On-Hand Count | Physical shelf plus backroom stock | Units | Measured at review cycle R to reconcile actuals |
| Review Cycle (R) | Calendar interval between scheduled counts | Days or weeks | Sets how much demand each order must bridge |
| Picking / Order Quantity | Shortfall equal to S minus On-Hand | Units | Transferred to picking list or supplier order |
| Variance / Reconciliation | Difference between book stock and physical count | Units | Flags scrap, human error, or theft for correction |
How should stores prioritize PAR reviews with ABC classification and size buffers for perishables?
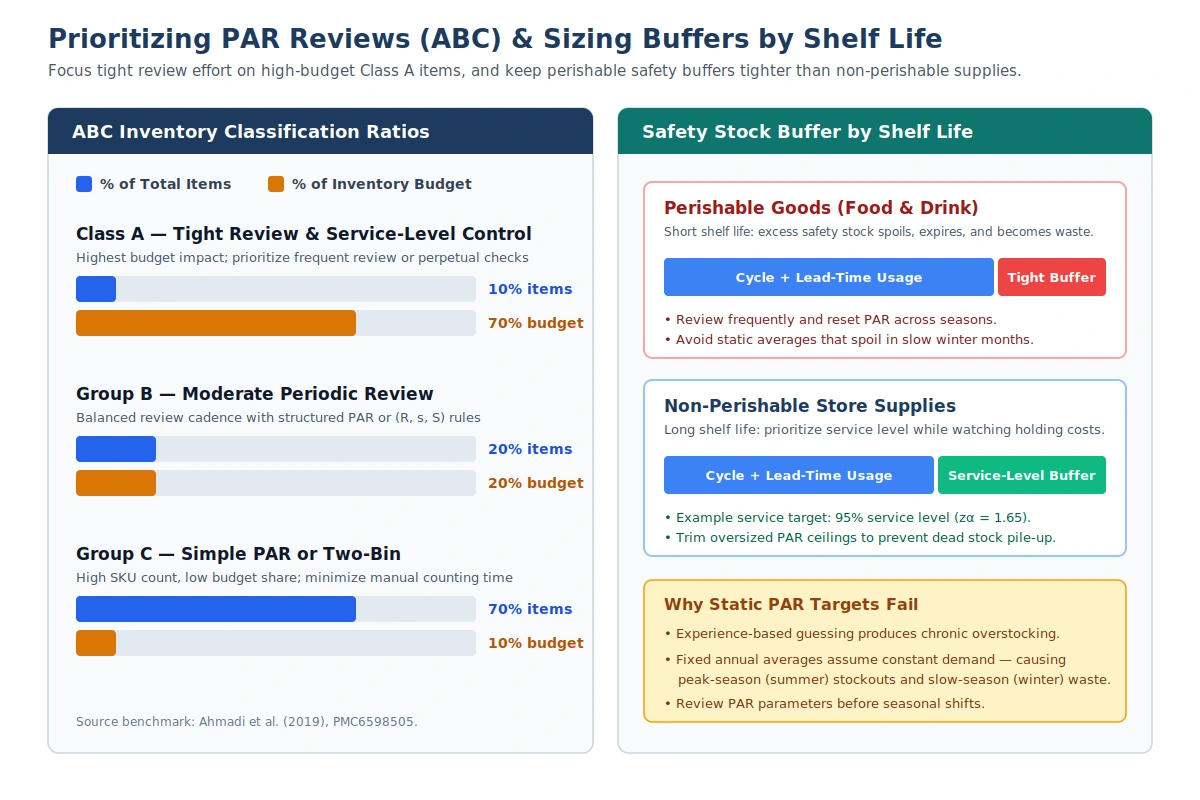
Stores should concentrate frequent review and safety-stock tuning on Class A items—roughly 10% of SKUs absorbing 70% of inventory budget—while applying simpler PAR or two-bin rules to Group C supplies representing 70% of SKUs and 10% of budget. Perishable food and drink require tighter safety buffers than non-perishable supplies to prevent spoilage and dead stock.
Applying ABC classification to review effort
Treating every SKU in a store with the same counting frequency wastes labor on low-value consumables while leaving high-budget items exposed to stockouts or excess holding cost. In standard ABC classification cited by Ahmadi et al. (2019), Class A accounts for about 10% of total items and 70% of budget, Group B accounts for 20% of items and 20% of budget, and Group C accounts for the remaining 70% of items and 10% of budget. Matching tight periodic or perpetual review to Class A and two-bin or simple PAR checks to Group C keeps counting labor focused where capital is concentrated.
Perishable restaurant buffers, seasonality, and dead stock prevention
Too much safety stock raises holding costs and causes stored products to spoil, expire, or break, whereas too little safety stock leads to lost sales and higher customer turnover. For time-sensitive items such as food, drink, and other perishable goods in cafes or restaurants, holding excess safety stock directly converts inventory into spoilage waste.
Static PAR targets also break down whenever demand is seasonal. Using fixed average and standard demand parameters assumes constant consumption—producing repeated stockouts during peak summer demand and excess waste during slow winter months. Updating PAR targets ahead of seasonal shifts and auditing slow movers keeps inventory control aligned with its core purpose: planning for sales and stockouts while preventing the pile-up of dead stock. To track how holding costs, shrink, and spoilage show up alongside occupancy and payroll, see our small-store operating cost worksheet.
| Inventory Segment | Share of Items / Budget (%) | Recommended Replenishment Method | Safety Buffer & Review Guidance |
|---|---|---|---|
| Class A (High Budget) | 10% of items / 70% of budget | Perpetual (r, Q) or tight periodic (R, s, S) | Explicit service-level buffer (for example, 95%, zα = 1.65) with frequent physical reconciliation |
| Group B (Mid Budget) | 20% of items / 20% of budget | Structured periodic PAR (R, S) or (R, s, S) | Moderate safety buffer reviewed ahead of seasonal demand shifts |
| Group C (Low Budget Supplies) | 70% of items / 10% of budget | Simple periodic PAR (R, S) or two-bin | Standard non-perishable buffer; minimize manual counting trips |
| Perishable Food & Drink | Varies by store format (%) | Short-cycle periodic PAR (R, S) | Tight safety stock to prevent spoilage, expiration, and seasonal winter waste |